Sydney, Australia, 2023. Micah Hill-Smith, a New Zealander who had spent five years as a consultant at McKinsey in Sydney, was building an AI research assistant for legal work. The deeper he went into the product, the more he found himself answering the same few questions every day: which model should this step use? For the same model, which API provider is faster and cheaper? Can the scores vendors publish be trusted at all? He later recalled on the Latent Space podcast that when you build a product with large models, in the end every step becomes an evaluation problem.
He looked for existing answers and found none. At the time, nobody was evaluating large models systematically and independently, and the scores vendors published often used the testing methods most favorable to themselves. That December, Google released Gemini 1.0 Ultra and announced that it beat GPT-4 on MMLU. On closer inspection, Gemini’s score used 32 samples plus chain of thought, while the GPT-4 score it was compared with used a different method.
Micah and George Cameron, an Australian in San Francisco, decided to do it themselves. George had also worked in strategy consulting, mainly for data center and technology companies. In their spare time, the two built a website called Artificial Analysis. It launched in January 2024 with a very simple initial feature: comparing the speed and price of the same model across different API providers. Soon after, the site was mentioned on the Latent Space podcast, developers found it was exactly what they needed, and it quickly drew attention.
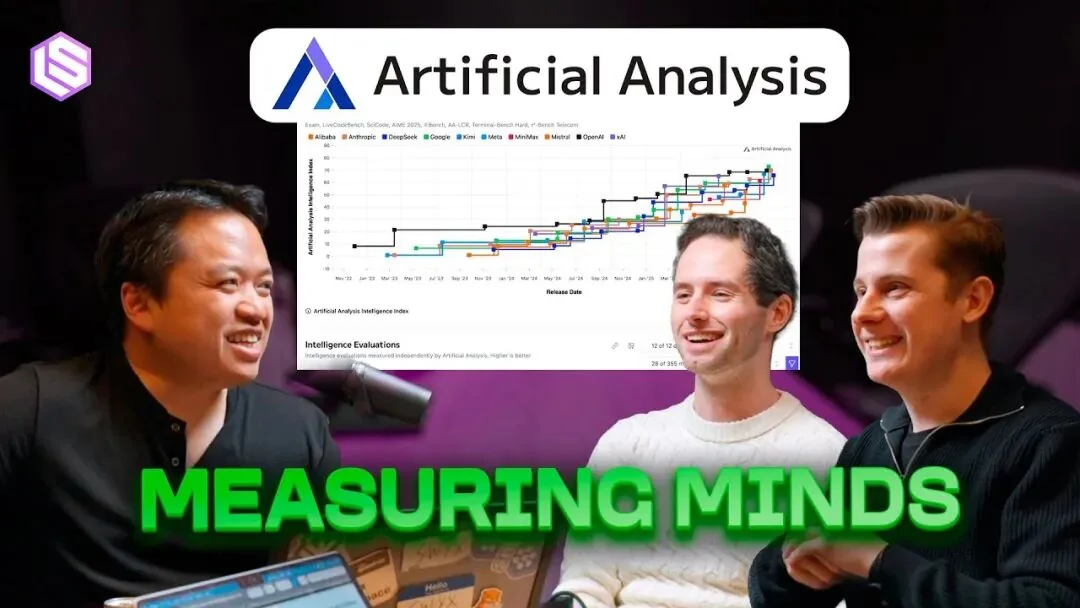
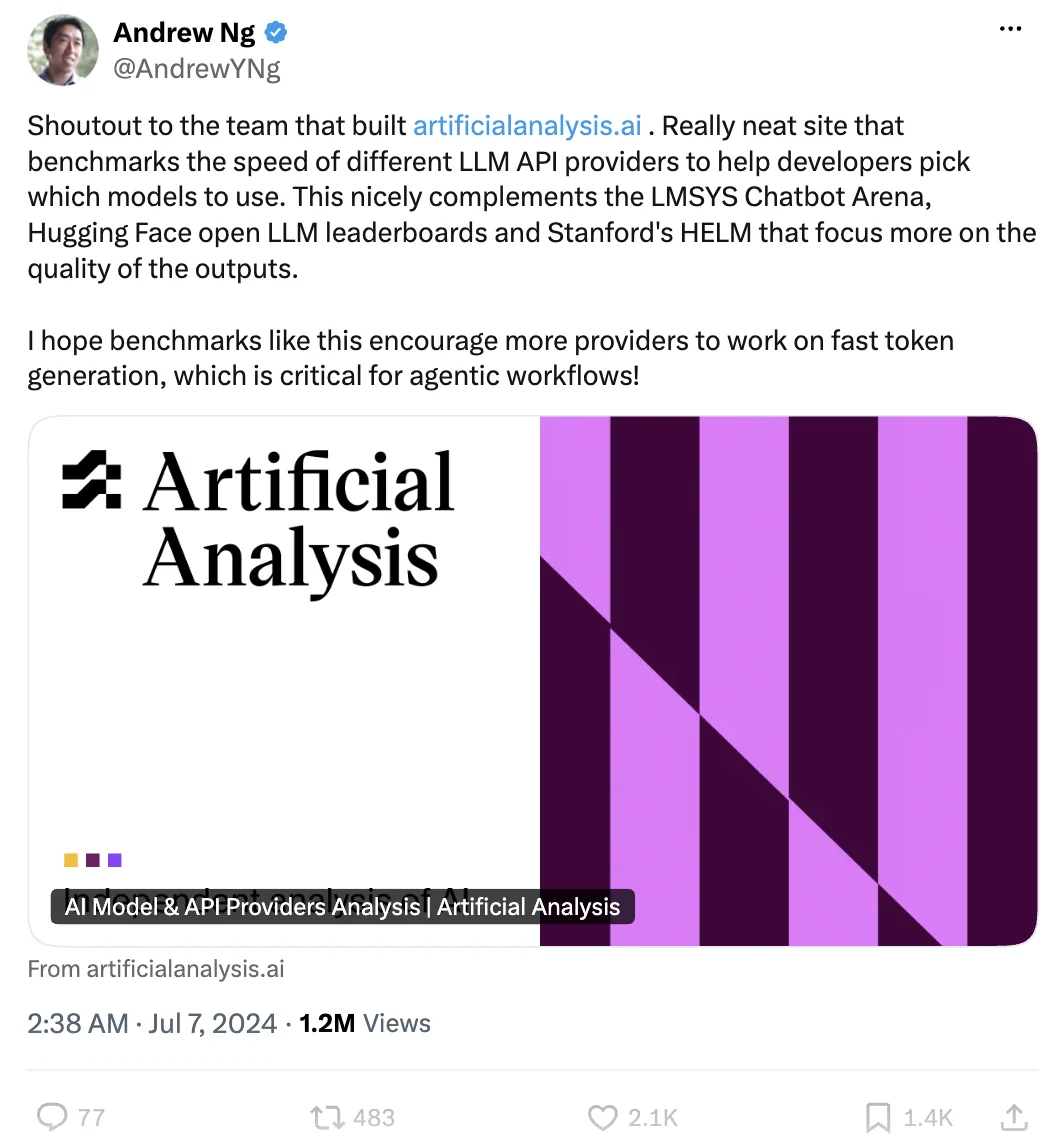
In July 2024, Andrew Ng singled it out for praise on X: the site benchmarked the speed of different LLM API providers and could help developers choose models. The post was viewed 1.2 million times, and Lex Fridman replied that it was “very useful.” swyx, the host of Latent Space, later became one of its investors.
Things moved quickly after that. The two joined the AI Grant program run by Nat Friedman and Daniel Gross, the company moved from Sydney to San Francisco, and its investors included Andrew Ng. They set themselves a rule: nobody can pay for a position on the leaderboard. The public leaderboards are free, and revenue comes from selling evaluation report subscriptions to enterprises and running customized private evaluations for AI companies. To prevent vendors from treating their evaluation accounts differently, they register accounts with non-company domains and call each vendor’s API anonymously, which they call their “mystery shopper” strategy. By the end of 2025, the company still had only about 20 people.
What truly made it the focus of the industry was the “Intelligence Index” it later launched. The 2025 version mainly reran mainstream academic benchmarks such as MMLU-Pro, GPQA, HLE, LiveCodeBench, SciCode, and AIME with a unified method and combined them into a total score. For the first time, every vendor’s models could be compared under the same conditions. The third version added Terminal-Bench and customer-service agent tasks; the fourth version in January 2026 added new evaluations such as GDPval-AA, AA-Omniscience, and CritPt, and regrouped the whole index into four categories: agents, coding, general, and scientific reasoning. After that the index was updated more and more often: v4.1 in June, v4.2 on September 4, and just three days later, on September 7, v4.3. By September this year, the index covered more than 600 models.
From a side project in Sydney to a leaderboard the whole industry watches, Artificial Analysis took less than three years.
Who decides which large model ranks first?
Over the past year or so, with almost every large model release, you will have noticed the same detail: the release materials always include Artificial Analysis numbers. When xAI released Grok 4.6 in August, it put its then Artificial Analysis Intelligence Index score of 61 straight into its own results table. Shortly after Zhipu released GLM-5.3 in August, it became the highest-scoring open-weight model on the new version of the Artificial Analysis index, with 45 points. When Xiaomi released MiMo-V2.6-Pro in September, the core of media coverage was that it topped the open-weight ranking on this leaderboard with 46 points. When Kimi K3 was released in July, the line most often repeated was “third in the world on the Artificial Analysis Intelligence Index.” Even Anthropic and Google cite GDPval-AA results run by Artificial Analysis in their release tables.
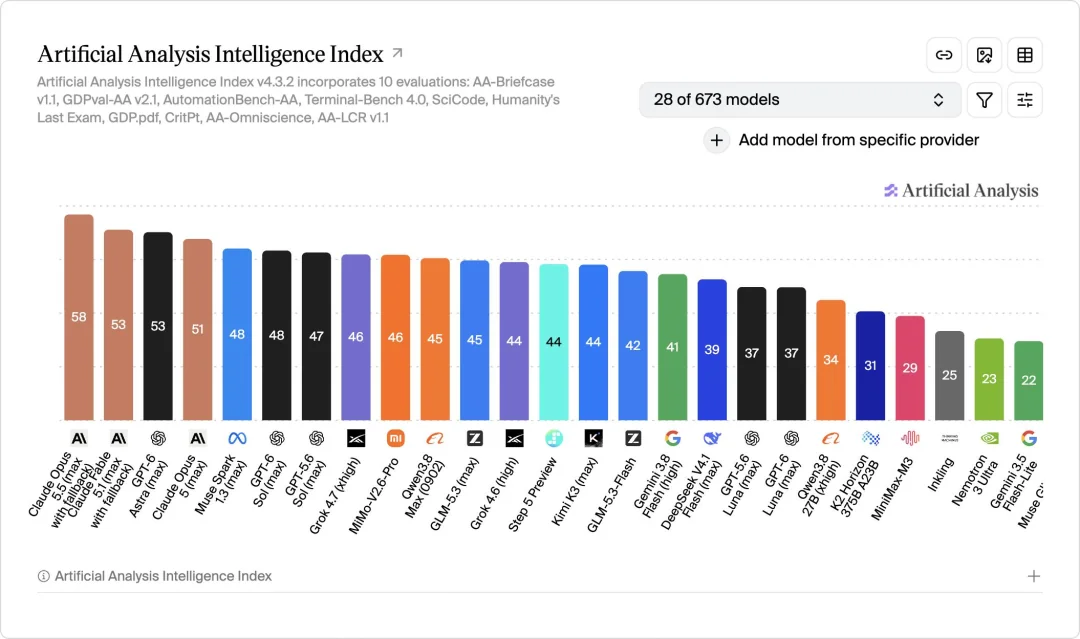
My gut feeling is this: when a new model is released today, if it cannot clearly beat its own previous generation or its contemporary competitors on Artificial Analysis, the release makes almost no noise in public opinion. An independent evaluation organization less than three years old has become an unavoidable part of every new model release in the industry.
That in itself is fine. But it raises a new question: when everyone is competing for first place on the same leaderboard, have we seriously considered how the leaderboard is calculated, what it can reflect, and what it cannot? And by what logic are the scores vendors publish themselves selected?
To answer these questions, we first need to explain benchmarks themselves: how they are made, what each one measures, which results vendors choose to publish at release, and how third-party leaderboards compute a total score. Only by understanding these can we see why gaps appear between scores and real-world experience.
1. What the common types of benchmarks measure
The idea of a benchmark is simple: find a set of tasks with standard answers or clear grading rules, have the model do them, and count how many it gets right. The hard part is choosing the tasks. Different tasks measure completely different capabilities. Over the past few years, mainstream benchmarks in the industry have shifted roughly from testing knowledge, to testing coding, to testing whether a model can complete an entire piece of work. Below I introduce some of the most frequently cited ones.
MMLU and GPQA: the knowledge-question era. MMLU appeared in 2020 and covers more than ten thousand multiple-choice questions across 57 subjects, from high school math to law and medicine. It was once the standard test of a model’s breadth of knowledge, but frontier models have long scored close to perfect, and almost no vendor puts it in a release table anymore. GPQA Diamond is a harder version: 198 biology, chemistry, and physics questions written by PhD-level experts, designed so that the answers are hard to find even with a search engine. In 2026, frontier models generally score above 90% on GPQA, and it too is losing its power to discriminate. These tests are good at measuring knowledge and single-step reasoning, but they do not touch on whether a model can actually complete tasks.
HLE (Humanity’s Last Exam): academic questions pushed to the limit. HLE was released by the Center for AI Safety and Scale AI in January 2025. It solicited questions from scholars worldwide and ultimately included 2,500 questions across more than a hundred subjects, including mathematics, the humanities, and the natural sciences. A question was included only if it stumped the strongest models at the time. To attract high-quality questions, the organizers offered 500,000 dollars in prizes: 5,000 dollars each for the top 50 questions and 500 dollars each for the next 500. At release, the best model scored under 10%; by September 2026, Claude Opus 5.5 had reported 67.7% with tool use allowed. HLE is good at measuring expert-level knowledge and depth of reasoning, but most of its questions are hard problems with a single correct answer, very different from everyday work that requires repeated trial and error and has no standard answer. Such questions are also bound to contain mistakes: an independent review in July 2025 found that roughly 30% of the reference answers to some chemistry and biology questions in HLE were problematic, after which HLE introduced a continuously revised version.
The SWE-bench family: fixing issues in real codebases. SWE-bench was released by researchers at Princeton University in 2023. It collected 2,294 real GitHub issues from 12 popular open-source Python projects and required models to understand the codebase, write a fix, and then check it with the project’s own tests. For the first time, writing code moved from solving algorithm puzzles to solving problems in real engineering. In 2024, OpenAI worked with the authors to have 93 professional developers review the questions one by one, selecting 500 questions with clear descriptions and reasonable tests: the widely cited SWE-bench Verified.
What happened to this family later says a lot about the lifespan of benchmarks. In February 2026, OpenAI announced it would no longer report SWE-bench Verified: it reviewed 138 of the questions and found that 59.4% of the test cases would mark functionally correct answers as wrong; at the same time, every frontier model tested could recite parts of the original solutions, indicating that the questions had entered training data. OpenAI then recommended that the industry switch to SWE-bench Pro from Scale AI. But in July, OpenAI reviewed SWE-bench Pro as well, found problems with about 30% of its tasks, and publicly withdrew the recommendation.
DeepSWE: coding tasks written from scratch. It was against this background that Datacurve released DeepSWE in May 2026. Its 113 tasks span 91 code repositories and 5 programming languages, and all were written from scratch rather than adapted from any existing commit, so there is no chance a model saw the answers in training. Its reference solutions average 668 lines of code, more than five times those of SWE-bench Pro, and all models run through the same general-purpose agent framework, mini-swe-agent. In just a few months, it has become the most common coding benchmark in vendors’ release tables.
Terminal-Bench: multi-step tasks on the command line. Terminal-Bench was launched by Stanford University and the Laude Institute in 2025. Each task has four parts: a text instruction describing what to do, a container environment with files and dependencies preinstalled, a reference solution proving the task can be completed, and a set of automated tests that check the final result. The model has to read files, install software, change configurations, and run programs in the terminal on its own, and the tests decide whether it succeeded. The tasks go beyond coding to include system administration, data processing, model training, cybersecurity, and scientific computing. It measures the ability to carry out continuous multi-step operations, which is why the second half of this article focuses on it.
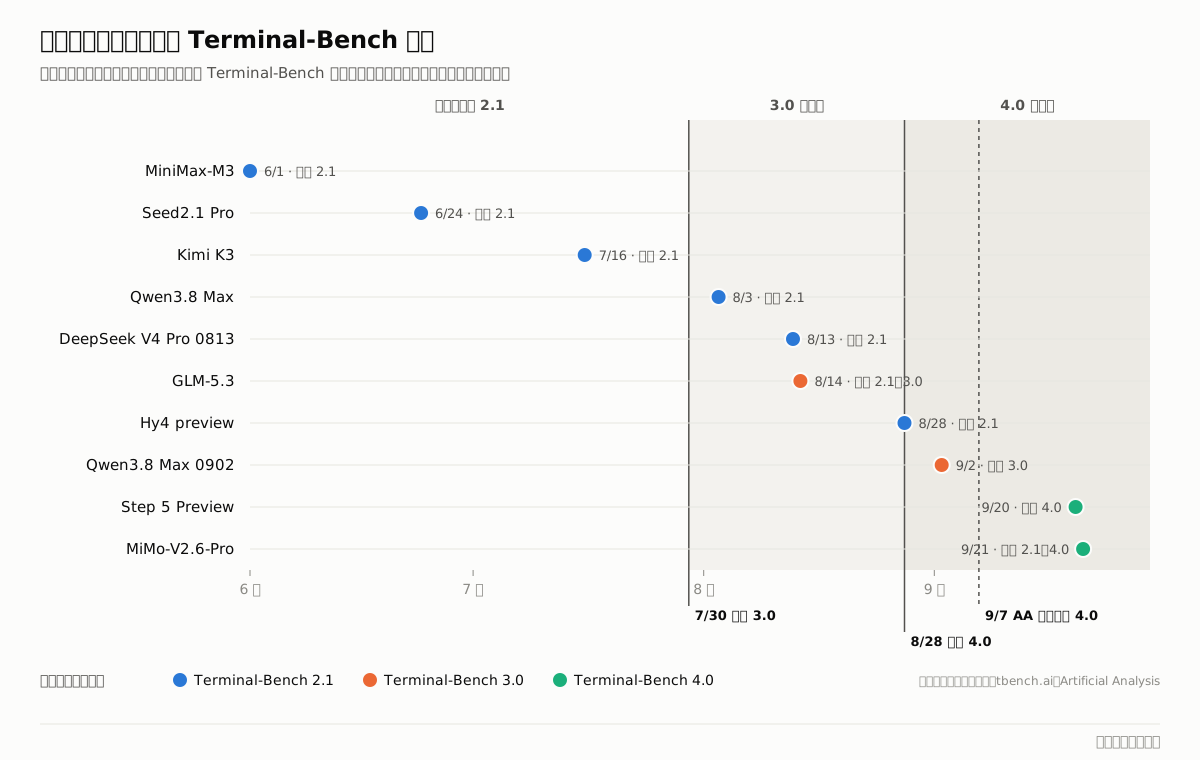
It is updated quickly: version 2.0 was released in November 2025; version 2.1 in May 2026 fixed 28 tasks from 2.0; version 3.0, released on July 30, contained 74 brand-new, harder tasks; and version 4.0, released on August 28, removed 8 tasks from 3.0, fixed 19, and set a uniform runtime limit of 8 hours per task.
GDPval: measuring models with professional work. GDPval is an evaluation OpenAI released in September 2025. It selected 44 occupations from the 9 industries that contribute most to US GDP and had professionals with an average of more than 14 years of experience design 1,320 tasks based on work they had actually done. The required outputs are real deliverables such as legal documents, financial statements, engineering drawings, and nursing plans. Grading is done by experts in the same industry who compare, without knowing the author, whether the model’s work or the human expert’s is better. It aims to answer how far models still are from human experts on economically valuable knowledge work.
Agents’ Last Exam: hard professional tasks for agents. This is a new evaluation released in June 2026 by Dawn Song’s team at the University of California, Berkeley, its name an obvious tribute to HLE. More than three hundred experts from over a hundred institutions helped write its more than 1,500 tasks, covering 55 non-manual occupations in the US occupational classification. Every task comes from a project a human expert actually completed, taking humans hours to weeks; models must work in full graphical and command-line environments, and success is judged by objective rules. At release, every frontier agent had a success rate of 0 on the hardest tier, and the cost of running each task ranged from 1.33 to 15.70 dollars.
OSWorld: operating a computer. OSWorld was released in 2024. It has models operate a real computer system through screenshots, mouse, and keyboard to complete tasks such as organizing spreadsheets, changing settings, and handling files across applications. It was followed by the human-verified OSWorld-Verified and, in 2026, OSWorld 2.0. It measures the ability to use a computer, which is a different thing from writing code.
Arena: letting users vote. The last type is completely different. Arena started in 2023 as Chatbot Arena from the LMSYS team at Berkeley: a user asks a question, two anonymous models each answer, the user picks the one they prefer, and the platform converts large numbers of pairwise comparisons into a ranking. It has no standard answers; it measures user preference. Section 3 discusses it in detail.
Looking at these tests together, a pattern emerges: the time from a benchmark’s release to frontier models maxing it out keeps getting shorter. MMLU took three or four years, GPQA about two, SWE-bench Verified was abandoned by OpenAI a year and a half after release, and within less than a year a batch of models scored above 85 on Terminal-Bench 2.x. The pace of writing new benchmarks can hardly keep up with the pace of model progress.
2. How the Artificial Analysis Intelligence Index is calculated
With these common benchmarks introduced, let us return to Artificial Analysis from the beginning of the article. Its current Intelligence Index, v4.3.2, consists of ten evaluations in four categories, each with its own weight:
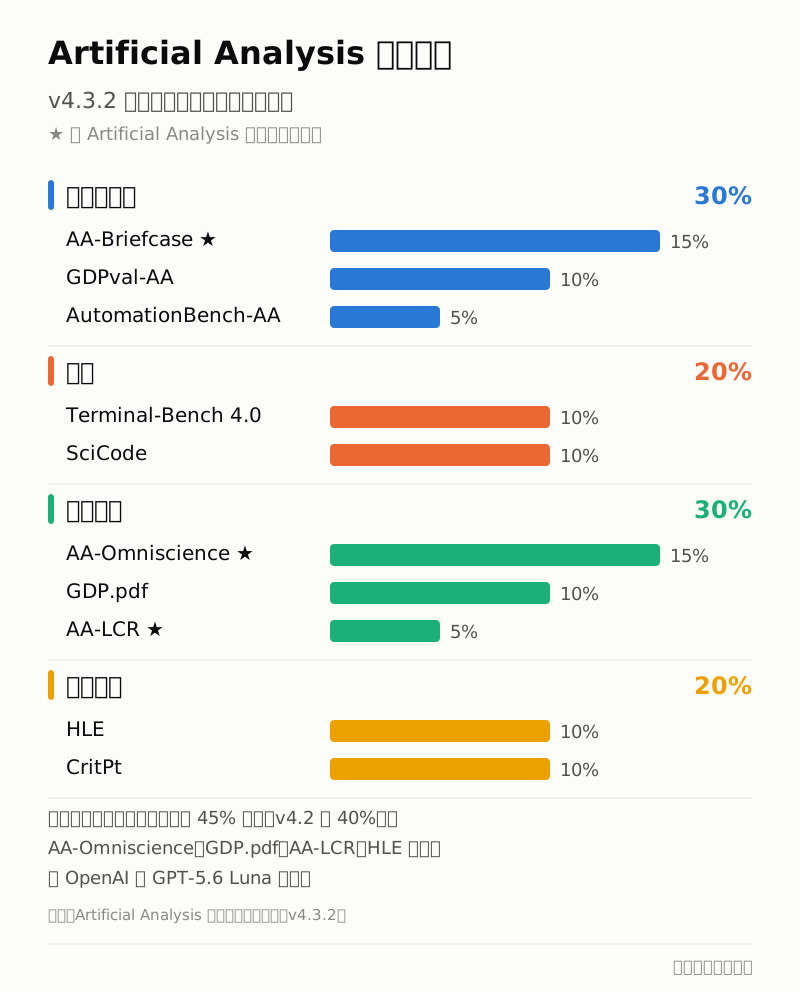
HLE, Terminal-Bench, and GDPval were introduced above; here are the rest, one by one.
AA-Briefcase is an evaluation designed by Artificial Analysis itself and carries the highest weight in the index. It contains 91 knowledge-work tasks across 4 business scenarios; the model works as an agent for up to 500 turns and delivers its results as files. Grading is done by a panel of three models, which both check each item against a rubric and compare two outputs pairwise, with the results converted into Elo scores. The questions are not public.
GDPval-AA is Artificial Analysis’s automatically graded version of the 220 public GDPval tasks from OpenAI. Models complete tasks and generate files in a sandbox preinstalled with 419 Python libraries and 762 system packages, and then a panel of three models makes anonymous pairwise comparisons. The results are converted into Elo scores, with DeepSeek V4.1 Flash’s result set as the 1600-point baseline. Its biggest difference from the original GDPval is that model judges replace human expert judges.
AutomationBench-AA comes from Zapier and measures business process automation across software. Its 657 tasks span six areas: finance, HR, marketing, operations, sales, and customer service. Models must operate simulated applications such as Gmail, Slack, and Salesforce through REST APIs, and a program then checks whether the state of each system is correct. If a model violates a preset safety rule, the task scores zero. Artificial Analysis uses a non-public test set.
SciCode was written by an academic team and requires models to solve scientific computing problems in Python. It has 288 subproblems, each with background written by scientists, and code counts as correct only if it passes all unit tests.
AA-Omniscience is a knowledge and hallucination test designed by Artificial Analysis, with 6,000 open-ended questions across 42 topics including business, the humanities, health, law, software, and science. Its distinguishing feature is that it penalizes fabrication: wrong answers lose points, while choosing not to answer when unsure does not. The final score combines accuracy and the rate of not hallucinating.
GDP.pdf comes from Surge AI and measures the ability to read and analyze long professional documents. Its 100 tasks use 4,592 pages of PDF documents from 10 professional fields as material, and each task has several specific grading criteria, 1,275 in total, which a model judges one by one.
AA-LCR is a long-context reasoning test designed by Artificial Analysis: 100 hard questions, each requiring the model to read about 100,000 tokens of documents before answering. The whole test involves about 230 documents and 3 million tokens of input and requires models to support a context window of at least 128,000 tokens.
CritPt is a research-level physics reasoning test. Its 70 questions are all unpublished frontier physics problems, with answers that may be numbers, symbolic expressions, or Python functions, graded by the CritPt team’s official grading server.
The evaluations vary greatly in scale and procedure: AA-Omniscience has 6,000 questions and runs once; Terminal-Bench 4.0 has 66 tasks, each run three times; CritPt has only 70 questions, but each runs five times. The index is mainly based on English text tasks; multilingual, image, and speech capabilities have separate indexes, and speed and price are also tracked separately and not counted in the Intelligence Index.
Why its value as a reference is declining
Let me be clear first: what Artificial Analysis does is very valuable, and its methodology documentation is far more transparent than most vendors’ release materials. My view is this: it remains a very useful reference for understanding the overall state of the industry, but its value as the final word on “which model is strongest” is declining. There are several reasons.
First, more and more of the evaluations in the index are led by Artificial Analysis, and many of their questions are not public. Of the ten evaluations, five already have “AA” in their names, and three of them, AA-Briefcase, AA-Omniscience, and AA-LCR, are entirely its own designs. By Artificial Analysis’s own account, evaluations with private questions or private answers account for 45% of the weight in v4.3, up from 40% in v4.2. Private question sets effectively prevent vendors from training against them, which is a real benefit; the cost is that outsiders have no way to verify them.
When nearly half of an index’s score comes from questions only the evaluator can see, it is closer to one organization’s professional opinion than to a measurement anyone can reproduce.
Second, the index changes versions so quickly that the meaning of the scores changes with it. In one week in September, the index was updated twice. With each update, every model’s score is recalculated: Kimi K3 scored 57 when it was released in July, ranking third in the world, and became 44 under v4.3.2; DeepSeek V4 Flash 0731 scored 50 at release and now scores 34. The models themselves have not changed at all; the scoring method has. Yet when media and vendors spread these numbers, they rarely say whether they were calculated under v4.2 or v4.3. Comparing a 57 from July with a 46 from September is meaningless.
Third, a considerable share of the grading relies on other vendors’ models as judges. AA-Briefcase and GDPval-AA are scored by a panel of three models; the answers for AA-Omniscience, GDP.pdf, AA-LCR, and HLE are all judged by OpenAI’s GPT-5.6 Luna. Having one competing vendor’s model grade all the contestants does not necessarily produce bias, but it is at least an issue that should be discussed openly.
Fourth, and the point we should care about most: a composite score averages away the most useful information. On Terminal-Bench 4.0, GLM-5.3 scores 42% and Kimi K3 13%, more than a threefold difference, yet on the composite index the two are only 1 point apart. For a developer choosing a coding agent, the gap between these two models on this task is decisive; for a user who mainly does long office-style tasks, Kimi K3 scores 1505 on AA-Briefcase, barely different from GLM-5.3’s 1516 and higher than GPT-5.6 Sol’s 1487.
Different users should look at completely different sub-scores. A single total score hides exactly these differences.
So my advice is: when you look at Artificial Analysis, don’t just look at the top row of the overall ranking. Pull out the few sub-scores you care about and look at them separately, and pay attention to the version number and date.
There is another phenomenon the industry should reflect on. Precisely because everyone uses Artificial Analysis scores for releases and promotion, the index itself has become a target every vendor optimizes for.
Economics has Goodhart’s law: once a measure becomes a target, it ceases to be a good measure of what it was meant to measure.
Any evaluation used by the whole industry will run into this problem sooner or later, and Artificial Analysis is no exception. Its frequent version updates and rising share of private questions are, to some extent, responses to this problem.
3. Are Arena rankings more objective?
In complete contrast to Artificial Analysis, Arena has no fixed question set; it lets real users vote. The mechanism is simple: a user asks a question, two anonymous models each give an answer, the user picks the one they are more satisfied with, and the platform uses a Bradley-Terry model to convert thousands of comparisons into a ranking. Hiding the brands reduces preconceptions, and questions from real users are closer to everyday use. Many people therefore consider Arena the most objective leaderboard.
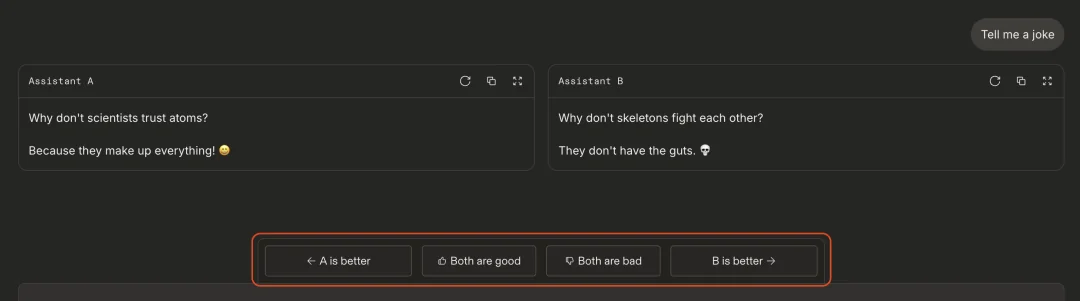
What Arena measures is real and valuable, but it reflects the preferences of a particular population on particular questions and should not be understood as an objective ranking of capability.
First, preferences are influenced by factors unrelated to capability. Arena’s own research found that longer answers, richer Markdown formatting, and a more positive tone are more likely to win votes. It later introduced “style control,” removing the effects of length and formatting when computing rankings. That correction itself shows that part of the uncontrolled raw ranking was grading writing style.
Second, platform rules affect the results. In 2025, researchers from Cohere and other institutions published the paper The Leaderboard Illusion, arguing that big vendors could privately test multiple model variants before an official release and publish only the best-performing one. The paper notes, for example, that Meta privately tested 27 variants before releasing Llama 4. Before that, Meta had also acknowledged that the Llama 4 Maverick ranked highly on Arena was an “experimental version optimized for conversation,” not the version developers could actually download. The paper also estimates that leading closed-model vendors receive far more battle data from the platform than open-weight models. Arena responded publicly that some of the paper’s data and descriptions were inaccurate and stressed that pre-release testing is meant to help vendors improve their models; after the Llama 4 incident, Arena also updated its rules for listing models.
Third, what voters can judge is limited. An ordinary user can quickly tell which answer reads more smoothly and is better organized, but has a hard time judging whether a piece of code will run in production, or whether an analysis report contains hidden factual errors.
Arena is good at answering which model users prefer to talk to, not which model can better get a complex piece of work done.
So Arena’s rankings are well suited to judging a model’s conversational experience, but the words “blind testing by real people” do not automatically make it an objective, general ranking of capability.
4. Which benchmarks vendors publish at release
After two third-party leaderboards, let us look at which results vendors choose to publish themselves when they release new models. I went through the official materials for the most recent flagship release of each of the 13 vendors covered in this article, including release announcements, model cards, and system cards, and compiled the benchmarks they reported into the chart below.
The chart has two parts. The upper part shows public benchmarks reported by most vendors; the lower part shows optional benchmarks reported by only a few, with evaluations named after vendors or designed by them listed separately at the bottom. Different versions of Terminal-Bench are counted separately. Within each part, items are sorted by the number of vendors that adopted them, from most to fewest.
The models included are: OpenAI GPT-6 Astra (September), Anthropic Claude Opus 5.5 (September), Google Gemini 3.8 Flash (September), xAI Grok 4.7 (September), Zhipu GLM-5.3 (August), Moonshot AI Kimi K3 (July), DeepSeek V4 Pro 0813 (August), Alibaba Qwen3.8 Max (August, including the 0902 update in September), Xiaomi MiMo-V2.6-Pro (September), StepFun Step 5 Preview (September), Tencent Hy4 preview (August), MiniMax-M3 (June), and ByteDance Seed2.1 Pro (June).
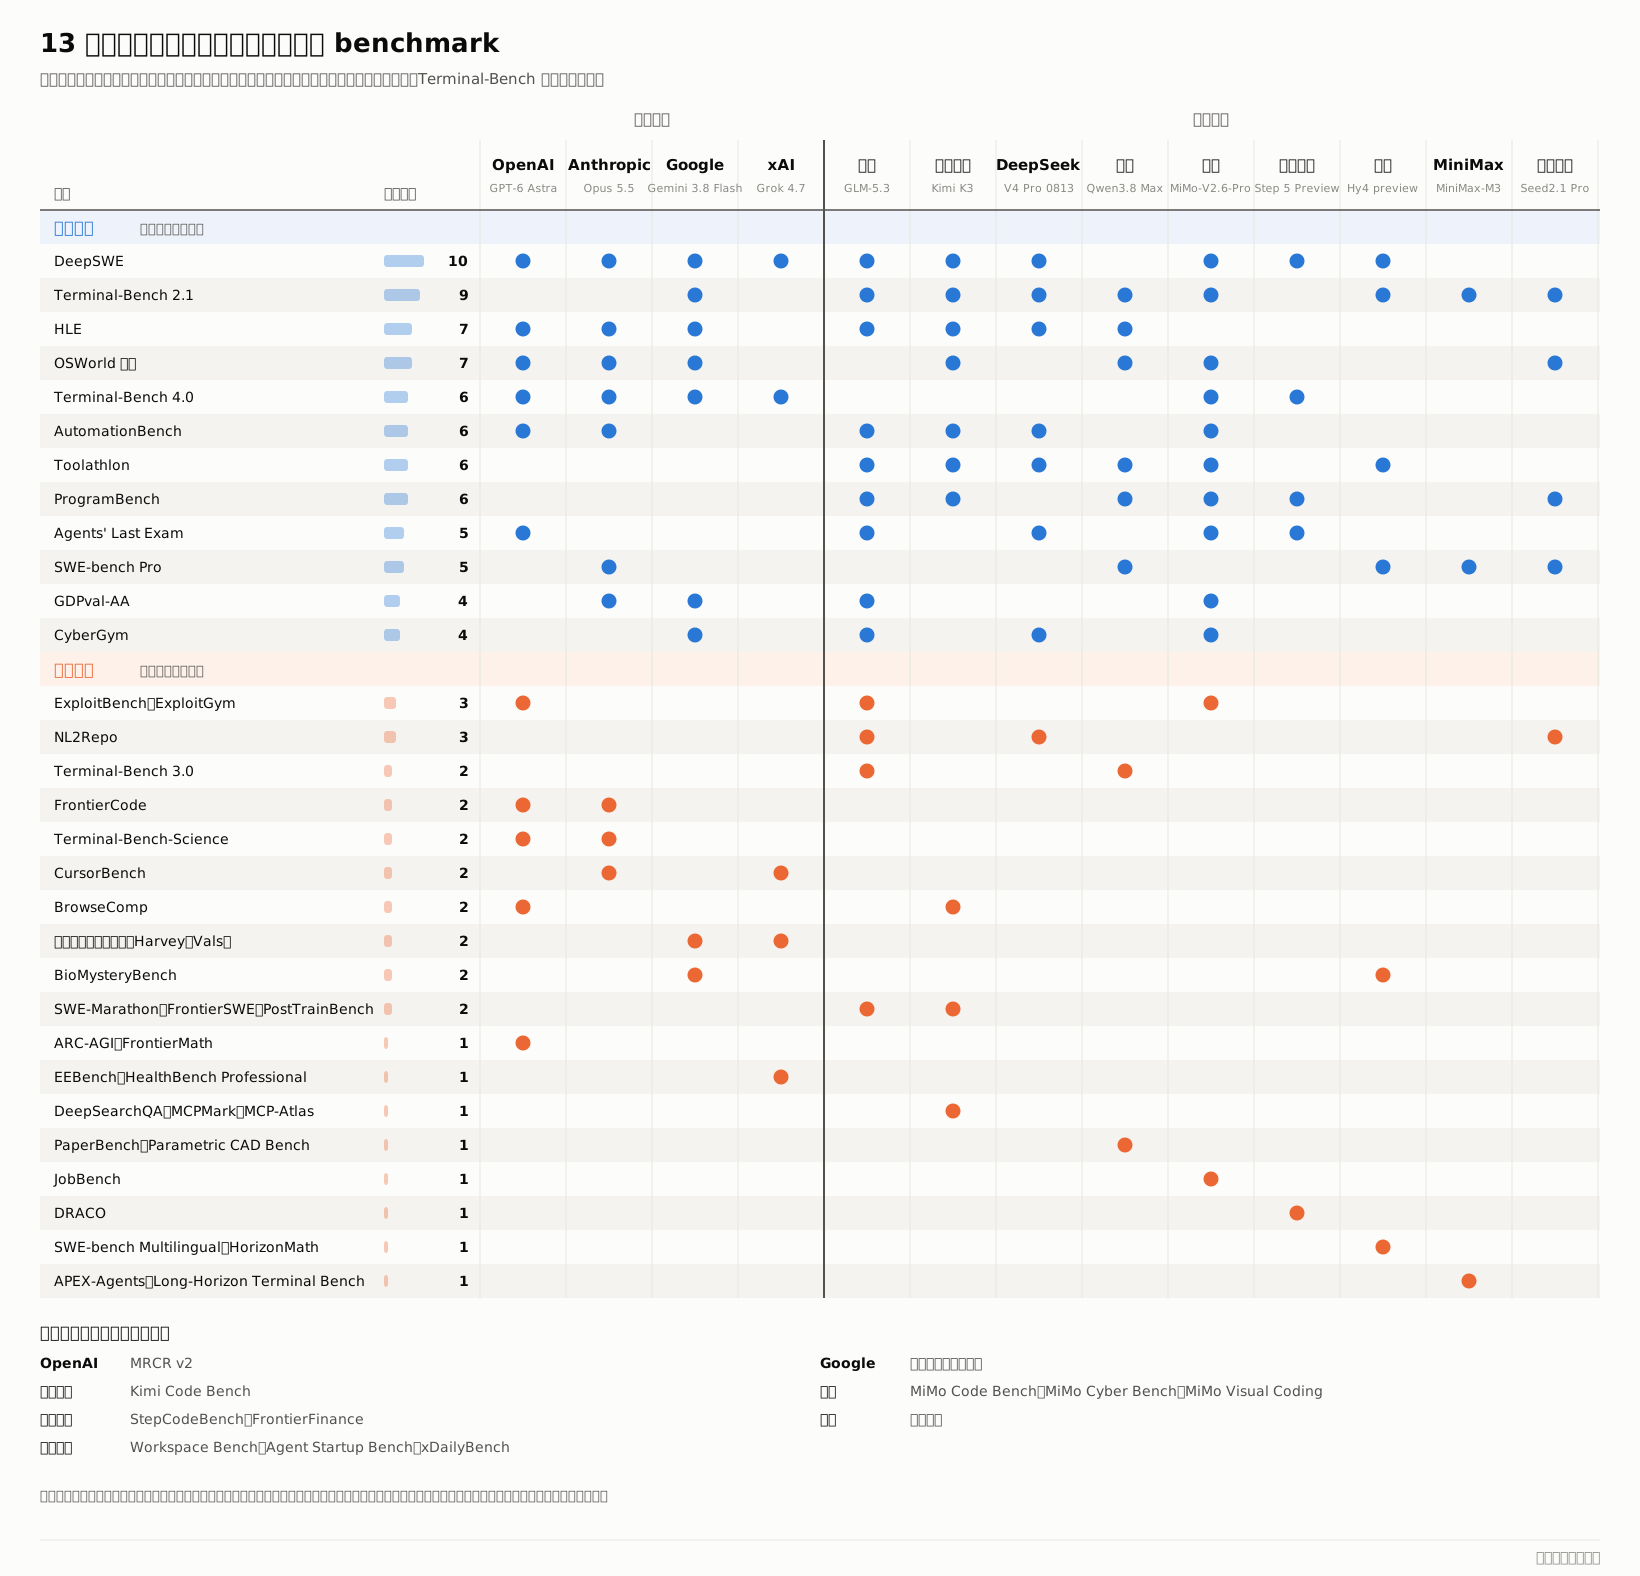
Several things stand out in this chart:
First, DeepSWE was adopted by 10 vendors in just four months, ranking first among all benchmarks, while SWE-bench Verified, which every vendor once reported, is now reported by only a few. OpenAI’s two reviews directly changed the whole industry’s choices.
Second, once the versions of Terminal-Bench are separated, the differences become obvious. Without distinguishing versions, Terminal-Bench is the only benchmark all 13 vendors have reported; but 9 reported version 2.1, 6 reported 4.0, and only Zhipu and Alibaba reported 3.0. Which version is reported depends largely on release timing: models released before the end of July could only report 2.1; models released in August could already report 3.0, but most still reported only 2.1; models released in September began reporting 4.0.
Third, the public benchmarks commonly used by Chinese and American vendors are not entirely the same. Toolathlon and ProgramBench appear almost only in Chinese vendors’ release tables, while FrontierCode, CursorBench, and Terminal-Bench-Science appear mainly in American vendors’ tables. This partly reflects whom each vendor compares itself with: Chinese vendors compare with each other more and tend to choose tests they have all reported.
Fourth, among Chinese vendors, Xiaomi and Zhipu have the broadest release tables. Of the 12 public benchmarks in the upper part, MiMo-V2.6-Pro reported 10 and GLM-5.3 reported 9, and Zhipu was one of the two vendors that put Terminal-Bench 3.0 into its release table as soon as it came out. How many public benchmarks a release table is willing to cover also reflects, to some extent, a vendor’s confidence in how its model fares in head-to-head comparison.
Fifth, optional benchmarks and in-house evaluations are very common; nearly every vendor has them. OpenAI reports ARC-AGI and FrontierMath, Google reports legal and biology research evaluations, xAI reports electrical engineering and medical evaluations, Kimi reports a whole set of search and tool-calling evaluations, and Xiaomi and ByteDance each have three evaluations named after themselves or designed in-house. This is understandable: vendors know best where they want their models to excel, and they need their own evaluations to guide research and development. But readers need to understand that a result reported by only one vendor, on questions and grading rules decided by that vendor, does not mean the same thing as a result on a public benchmark. The former tells you what the vendor values; only the latter can be compared across vendors.
5. Chinese open-weight models: who is first depends on the benchmark
Several “open-source number ones”
In the summer of 2026, competition among Chinese open-weight models was fierce. Claims of being “number one in open source” appeared several times within a few months, and each time they had a basis.
On July 16, Moonshot AI released Kimi K3. It was the largest open-weight model by parameter count at release, with 2.8 trillion total parameters and a context length of 1 million. In its own release table, it posted the top scores in the table on search and tool-calling evaluations such as BrowseComp (91.2), DeepSearchQA (95.0), and MCPMark (94.5), and it also beat Claude Fable 5 and GPT-5.6 Sol on ultra-long-horizon coding tasks such as SWE-Marathon. At its release, Artificial Analysis specifically noted that it ranked first on AutomationBench, with an average cost per task comparable to GPT-5.6 Sol and about half that of Opus 4.8.
In August, Zhipu released GLM-5.3. In the subsequent v4.3 of the Artificial Analysis index, it ranked first among open-weight models with 45 points. On the same base model, simply by scaling up post-training, GLM-5.3 raised its Terminal-Bench 3.0 score from the previous generation’s 4.6% to 28.3% and its DeepSWE score from 46.2% to 66.9%. On AutomationBench as tested by Artificial Analysis, it scored 62%, higher than GPT-5.6 Sol’s 60% and Claude Opus 5’s 57%. Zhipu also disclosed that during development, GLM-5.3 found 2,436 security vulnerabilities in 269 open-source projects and disclosed them to the projects through a public ledger. GLM-5.3-Flash, released at the end of August under the MIT license, has 320 billion total parameters and 18 billion active parameters, scored 42 on the Artificial Analysis index, and costs only 0.15 dollars per million input tokens.
Also in August, DeepSeek released V4 Pro 0813 and opened its weights under the MIT license, one of the most permissive licenses among this group of models. In its own release table, it reported 87.9% on Terminal-Bench 2.1, above Claude Opus 4.8’s 85.0%, and 83.3% on the CyberGym security evaluation, also above Opus 4.8. The earlier DeepSeek V4 Flash 0731 reflects DeepSeek’s consistent engineering style: 284 billion total parameters with only 13 billion activated per inference. Artificial Analysis measured its output speed at 211 tokens per second, 1.7 times that of GPT-5.6 Luna, with a time to first token of only 1.15 seconds.
On September 21, Xiaomi released MiMo-V2.6-Pro, also under the MIT license. It beat GLM-5.3 by one point on the Artificial Analysis index with 46, becoming the new open-weight number one. In its release table, Xiaomi published results on both Terminal-Bench 2.1 (89.9%) and 4.0 (34.9%), rather than picking only the one most favorable to itself.
These examples show that “number one in open source” has at least three layers of meaning that need to be spelled out. First, by which leaderboard and which version: the gap between first and third is often only one or two points, and the index itself is recalculated every few weeks. Second, how open: the MIT license and vendor-defined licenses differ in their restrictions on commercial use and modification. Third, in which capabilities: Kimi K3’s strengths in search, tool calling, and long office-style tasks, DeepSeek’s strengths in inference efficiency and open licensing, and GLM-5.3’s performance on terminal tasks and business process automation are first places in different directions to begin with.
What changed after the Terminal-Bench version update
These models’ scores on Terminal-Bench 2.1 are very close. By the numbers each vendor reported at release, MiMo-V2.6-Pro scored 89.9%, Kimi K3 88.3%, GLM-5.3 88.2%, and DeepSeek V4 Pro 0813 87.9%; GPT-5.6 Sol scored 88.8% and Claude Opus 5 89.1% in the same period. Frontier models are all clustered between 88% and 90%, less than two percentage points apart.
On September 7, Artificial Analysis upgraded the Terminal-Bench in its index from 2.1 to 4.0 and retested every model with the same agent framework, mini-swe-agent. The differences became large.
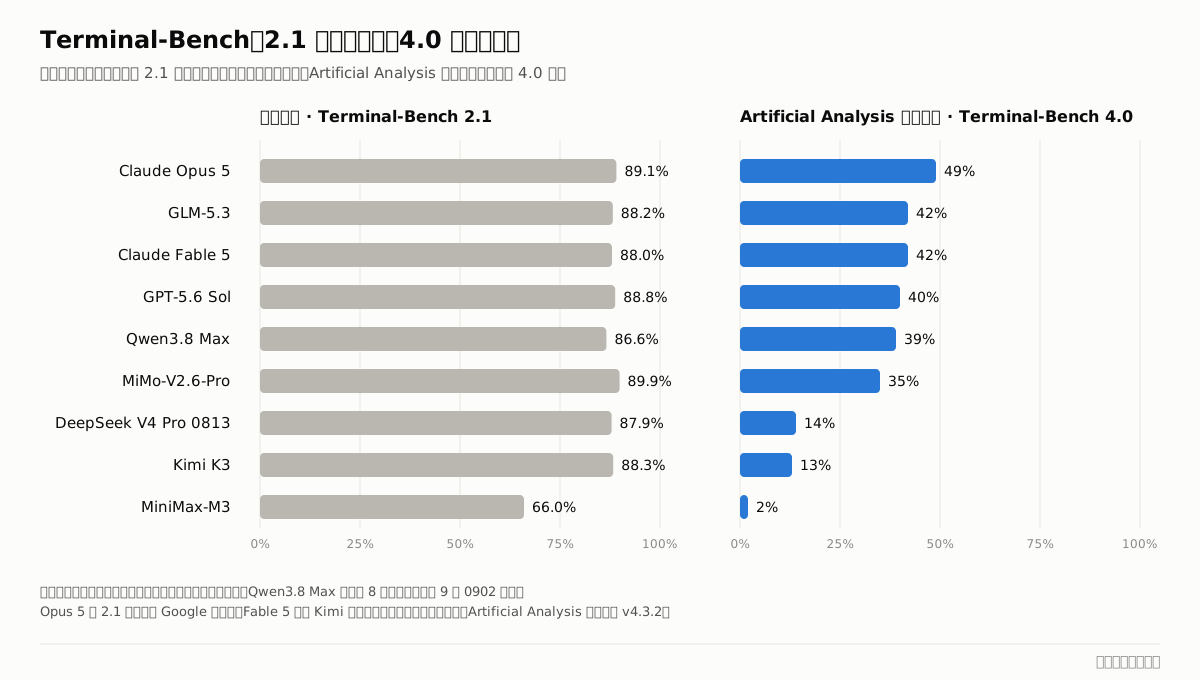
Version 4.0 is much harder than 2.1, and every model’s score dropped sharply, as expected. What is really informative is how relative positions changed. On 4.0, GLM-5.3 is the best-performing open-weight model, tied with Claude Fable 5 and above GPT-5.6 Sol; Qwen3.8 Max and MiMo-V2.6-Pro are on par with the previous generation of Claude and GPT flagships; while DeepSeek V4 Pro and Kimi K3 score noticeably lower. On the Terminal-Bench 4.0 leaderboard maintained by Snorkel AI, GLM-5.3 with the Claude Code framework scored 41.8%, essentially consistent with Artificial Analysis’s result, and it is the only open-weight model in that leaderboard’s top ten. Two organizations measuring nearly identical results with different frameworks suggests that GLM-5.3’s performance does not depend much on any particular test setup.
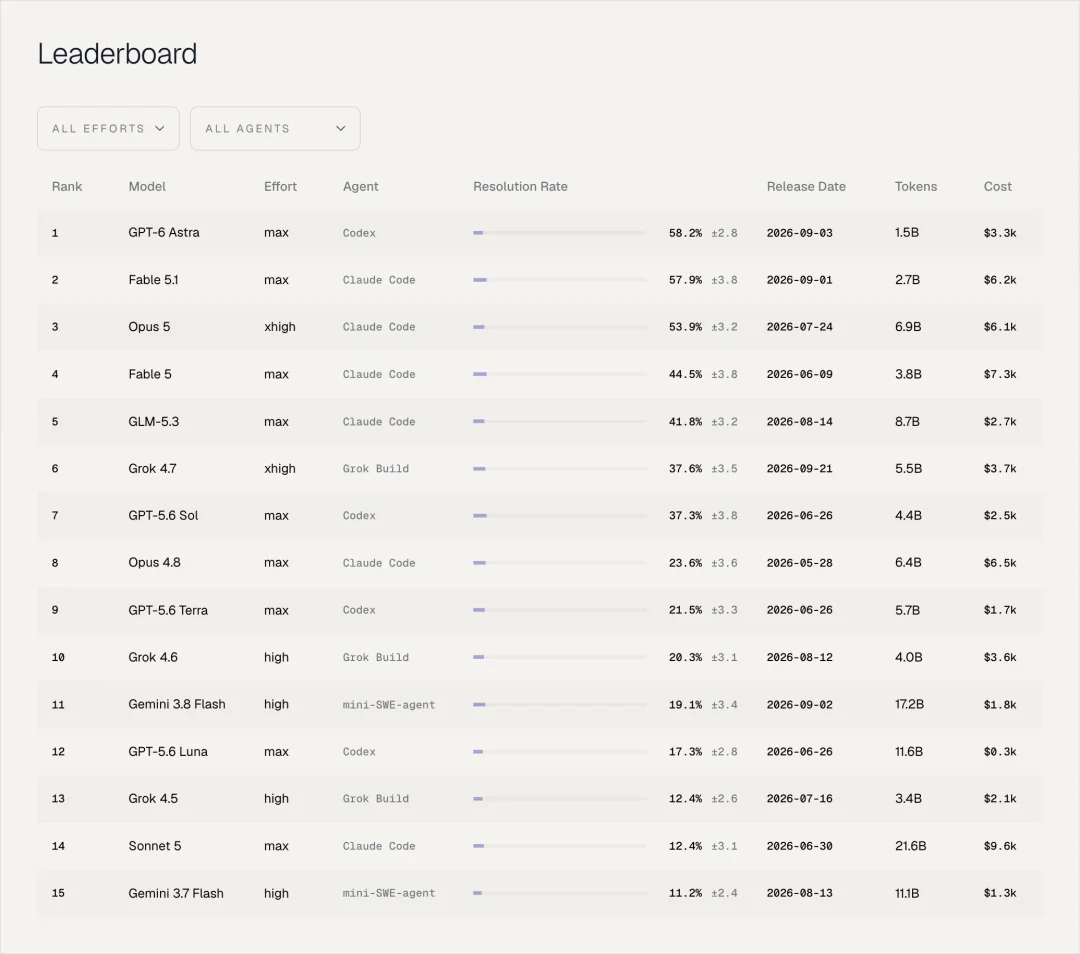
So the claim that “Chinese models declined across the board on the new version” does not hold. A more accurate description is that Chinese models have diverged.
How to read the Kimi and DeepSeek scores
For Kimi K3’s and DeepSeek V4 Pro’s results on 4.0, we should put several facts together; otherwise it is easy to reach unfair conclusions.
The first is timing. Terminal-Bench 3.0 was released on July 30 and 4.0 on August 28, and 4.0 was actually derived from 3.0’s 74 tasks by removing 8 and modifying 19. Kimi K3 was released on July 16, when 3.0 did not yet exist; DeepSeek V4 Pro 0813 was released on August 13, only two weeks after 3.0 was announced. In other words, when Kimi K3 was released, 2.1 was the latest version; when DeepSeek V4 Pro was released, 3.0 had been out for only two weeks, hardly enough time to include it in training and evaluation. During training, these two models had essentially no chance to encounter the task types of the 3.0 and 4.0 generation. By contrast, GLM-5.3 was released two weeks after 3.0 was announced and reported 3.0 in its release table; the September update of Qwen3.8 Max raised its 3.0 score from 11.3% to 29.0%. Performance on a new version depends heavily on whether a model finished training before or after that version appeared.
The second is the agent framework. Kimi K3’s 88.3% on 2.1 was measured with Moonshot AI’s own Kimi Code framework; DeepSeek V4 Pro’s score used the lean mode of its own DeepSeek Harness. Both vendors have invested heavily in their own coding agent tools, and DeepSeek Harness has received more than seventy thousand stars in the open-source community. Models deeply adapted to their own frameworks can be expected to perform worse on mini-swe-agent, the general-purpose framework Artificial Analysis uses. In addition, Artificial Analysis tested Kimi K3 at both its low and highest reasoning settings, and both scored 13% on 4.0: the reasoning effort went up, but the score did not change. This suggests the problem may not lie entirely in the model’s reasoning ability, and it is worth the evaluator and the vendor checking the run logs together.
The third is their performance on other agent tasks. In results tested by Artificial Analysis with the same unified method, Kimi K3 scored 1505 on AA-Briefcase, a long office-style task, above GPT-5.6 Sol’s 1487; 89% on the long-context reasoning test AA-LCR, above GPT-5.6 Sol’s 84% and Claude Opus 5’s 79%; and 58% on AutomationBench, also above Opus 5’s 57%. DeepSeek V4 Pro 0813 also scored 57% on AutomationBench, level with Opus 5. If Kimi and DeepSeek lacked long-chain agent capabilities, these numbers would not make sense. The gap on Terminal-Bench 4.0 is more likely a problem with a certain type of task under a certain testing method than a problem with overall capability.
Of course, these explanations cannot be turned around to deny the significance of the 4.0 results. If a model can only show its full strength in its own framework, that is a real limitation for developers who use other tools. For Kimi and DeepSeek, the most convincing response would be to publish their own results and complete run records on the new version. I look forward to seeing such data for their next-generation models.
6. How does the same model get different scores?
The previous section touched on agent frameworks; here I focus on why the same model on the same benchmark can get different scores from the vendor, the official leaderboard, and third parties.
An agent evaluation like Terminal-Bench never measures the model alone; it measures the combined performance of the model, the agent framework, and the runtime environment. The agent framework determines how the model calls tools, what format of error messages it sees, and when it stops; the runtime environment determines how much CPU and memory are available and how long each command can run. Change any one of these conditions, and the score changes.

A common practice in vendors’ release tables is to use the most suitable framework for each model. In Kimi K3’s release table, its own model uses Kimi Code, Claude uses Terminus 2, and GPT uses Codex, and the results from three different frameworks sit side by side in the same row. This practice has its logic, reflecting each model’s performance under the best conditions, but it is a different thing from a head-to-head comparison under uniform conditions.
Third-party numbers are not always higher or lower than vendors’ numbers. When Claude Opus 5.5 was released, it reported 66.4% on Terminal-Bench 4.0 at the xhigh reasoning setting; Artificial Analysis measured 59.6%. GPT-6 Astra reported 57.7%, but Artificial Analysis measured 59.1%, which is actually higher.
The runtime environment also matters. Anthropic ran an experiment: with the same model on the same Terminal-Bench 2.0, changing only the container’s resource configuration made scores differ by about 6 percentage points. Revisions to the questions themselves matter even more: Terminal-Bench 2.1 fixed 28 of 2.0’s 89 tasks, and as a result Opus 4.6 with Claude Code went from 58.0% to 70.1%. The model itself did not change at all, yet its score rose by 12 percentage points.
So when you see two scores that don’t match, your first reaction should be to check the conditions: the question set version, the scope of tasks, the agent framework, the reasoning setting, the resource configuration, the timeout settings, the number of repetitions, and whether the reported result is the average or the best run. Until the conditions have been checked, inconsistent scores are just a methodology issue and should not be taken as evidence that someone is cheating.
7. How much does an evaluation cost?
Readers usually see only a percentage, but behind both writing questions and running tests is a considerable investment.
First, writing the questions. To collect 2,500 high-quality questions, HLE offered 500,000 dollars in prizes. The 500 questions of SWE-bench Verified were selected after 93 professional developers reviewed them one by one. The 1,320 tasks of GDPval were written by professionals with an average of more than 14 years of experience based on their real work, and grading requires experts in the same industry to compare outputs one by one. The 74 tasks of Terminal-Bench 3.0 were created by more than a hundred contributors and reviewers; each went through multiple rounds of human and agent review, reference solutions, and trial runs by frontier models, and was then confirmed by domain experts. Agents’ Last Exam enlisted more than three hundred experts from over a hundred institutions.
Then, running the tests. Terminal-Bench 4.0 has a runtime limit of 8 hours per task, and Artificial Analysis runs each task three times, so 66 tasks means 198 complete agent runs. The 4.0 leaderboard maintained by Snorkel AI lists each model’s token usage and cost for one full run: Claude Fable 5 spent about 7,300 dollars per run, Claude Opus 4.8 about 6,500, Claude Fable 5.1 about 6,200, Claude Opus 5 about 6,100, GPT-6 Astra about 3,300, GLM-5.3 about 2,700, and GPT-5.6 Terra about 1,700. The biggest spender was Claude Sonnet 5, which used 21.6 billion tokens and about 9,600 dollars in one run, yet scored only 12.4%. GLM-5.3 scored 41.8% on this leaderboard and Claude Fable 5 44.5%, less than 3 percentage points apart, but one run of GLM-5.3 cost only a little more than a third of Fable 5’s.
The cost of running the full Artificial Analysis Intelligence Index varies even more across models. According to data published on the Artificial Analysis homepage, a full run costs more than 13,000 dollars for Claude Fable 5.1, about 8,700 for Claude Opus 5.5, about 5,300 for GPT-6 Astra, about 3,700 for Kimi K3, and about 2,500 for GLM-5.3, while DeepSeek V4.1 Flash costs only about 480, GLM-5.3-Flash about 280, Xiaomi MiMo-V2.6-Pro about 210, and the cheapest, GPT-6 Luna, about 120. The most and least expensive differ by more than a hundredfold. By average cost per task, GPT-6 Luna is about 0.07 dollars, MiMo-V2.6-Pro about 0.13, GLM-5.3-Flash about 0.25, GPT-5.6 Sol, Kimi K3, and GLM-5.3 all around 2, and the most expensive, Claude Fable 5.1, about 7.63. Artificial Analysis has also given a specific example: GLM-5.3-Flash and GPT-5.6 Terra both score 42 on the Intelligence Index, but the former costs only 18% as much per task (0.25 dollars versus 1.40). These figures include only the cost of calling the model under test, not additional costs such as calling the judge models or preprocessing documents.
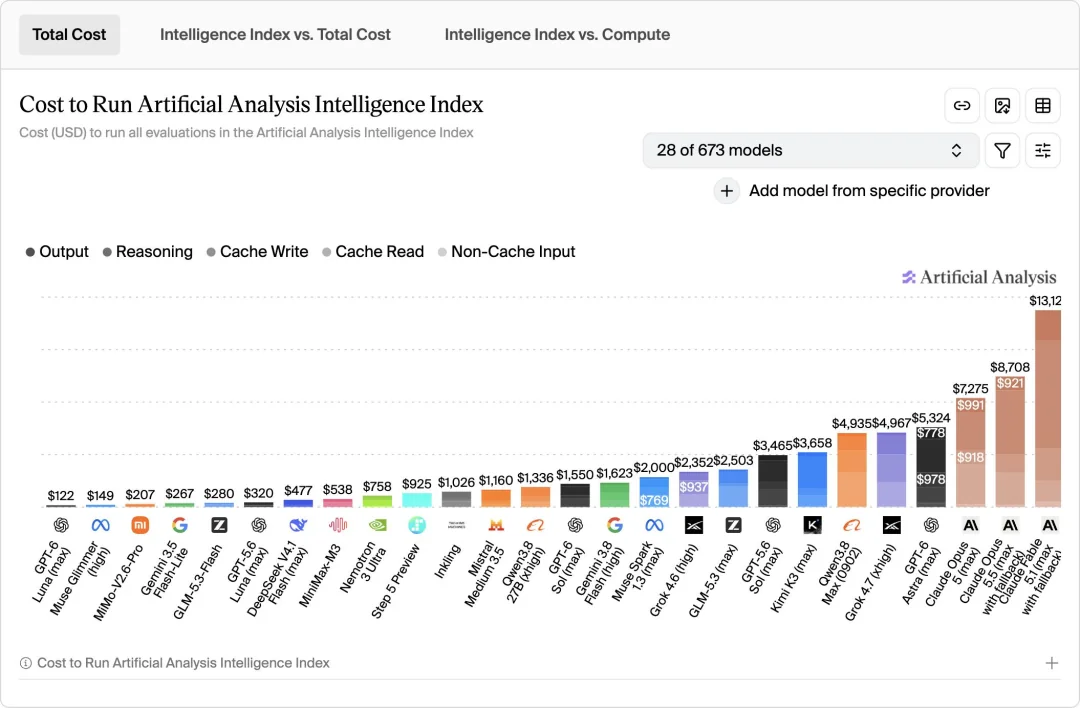
These numbers show two things. First, the scores most people see can only come from the vendors themselves or from very few third parties able to invest over the long term; ordinary teams can hardly retest everything. Second, behind the same score, the cost can differ several times over. For teams using models at scale, how much it costs to complete a task is often more important than a few points of score.
8. Where are the boundaries of leaderboard gaming?
When talking about benchmarks, it is hard to avoid the term “leaderboard gaming.” But I think the term should be used carefully, and we should at least distinguish three completely different kinds of behavior.
The first is outright cheating. In April 2026, Terminal-Bench published several cases: an agent called OB-1 hid encrypted reference answers in program files and publicly apologized after being removed from the leaderboard; an agent called Pilot uploaded each task’s test folder during initialization; and an agent called ForgeCode downloaded public solutions from the internet at runtime, and its results were changed to zero. Since then, Terminal-Bench has required every passing run to submit a complete run trajectory and uses an automated review program to check, entry by entry, for cases of “completing a task by exploiting a loophole without demonstrating the capability the task was meant to measure.” It should be noted that all of these cases came from developers of agent tools, not model vendors.
The second is test questions mixed into training data. This is usually not intentional, but its effects are obvious. GPT-6 Astra scored 100% on ExploitBench, a vulnerability exploitation evaluation, but on vulnerabilities newly disclosed between June and August 2026, which the model could not have seen during training, it scored only 39%. One reason OpenAI abandoned SWE-bench Verified was also that every frontier model could recite parts of the original solutions.
The third is optimizing for public benchmarks. This is the most common and the hardest to define. Adjusting training data, optimizing agent frameworks, and tuning reasoning budgets to perform better on an evaluation is normal work every vendor does, and many of these improvements genuinely improve models on real tasks. The issue is degree: when every frontier model already scores above 88% on a benchmark, fighting for a lead of a few tenths of a point mostly reflects familiarity with that question set rather than new capability. In 4.0, the Terminal-Bench team removed two tasks that “all the latest models passed in all five runs,” precisely because they could no longer distinguish between models.
We should also recognize that new versions are adapted to quickly too. Qwen3.8 Max raised its 3.0 score from 11.3% to 29.0% within a month; GLM-5.3 raised its 3.0 score from the previous generation’s 4.6% to 28.3%. This is real progress, as GLM-5.3’s performance on 4.0 has shown; but it also shows that once a new version becomes the recognized target, the time during which it can effectively distinguish models will be even shorter than for the previous version.
9. How to judge a model: what I care about most is adoption a week after release
After all this background on benchmarks, I want to share my own attitude: I never readily trust any vendor’s published benchmark results and rankings, including third-party leaderboards that look authoritative. I am in many groups and communities where frontier developers gather, and when I judge a model, I mainly look at how it is actually adopted in developer communities a week after release.
All the problems discussed above, including leaked questions, different test conditions, composite scores masking differences, and optimization for specific evaluations, create gaps between scores and real capability. Developers’ choices, on the other hand, are votes cast with real work. When a developer is willing to swap a new model into the workflow they use every day, it means the model has held up on real codebases, real documents, and real business problems. This test has no standard answer, but it is very hard to optimize for.
What I do in practice: after a new model is released, I ignore the “shocking” and “mind-blowing” hype, hold off on conclusions, and watch for a week. During that week, I look at how many people in the frontier developer groups and communities I belong to are seriously trying it, whether the feedback consists of specific success stories or vague impressions, whether anyone has made it their default model, and how many people switched back to their old model after two days. A week is long enough for the initial excitement to fade and for people to get results on real tasks.
If a model scores very high, but a week later community feedback is lukewarm and few people actually use it, I usually conclude one of the following: either something went wrong in training, such as over-optimizing some aspects at the expense of other capabilities; or the model itself has flaws, such as insufficient stability or instruction following in real environments that falls short of what it showed in tests; or the vendor adopted strategies aimed specifically at leaderboards. Conversely, if a model’s scores are unremarkable but more and more people in the community are using it, that often means it does well in areas some benchmarks don’t cover.
Besides direct feedback from the community, some public data can serve as a reference. OpenRouter is a platform many developers use to call model APIs, and its usage rankings reflect real adoption to some extent. In the 30 days through September 25, the top model was Zhipu’s GLM-5.3-Flash, with about 58.2 trillion tokens, followed closely by Tencent Hy4 preview and OpenAI GPT-5.6 Luna. Over the most recent week, DeepSeek V4.1 Flash and GLM-5.3-Flash tied for first with about 19.2 trillion tokens each, and DeepSeek’s V4 Flash 0731 ranked fifth. These models’ evaluation results at their respective price points are broadly consistent with how much they are actually used.
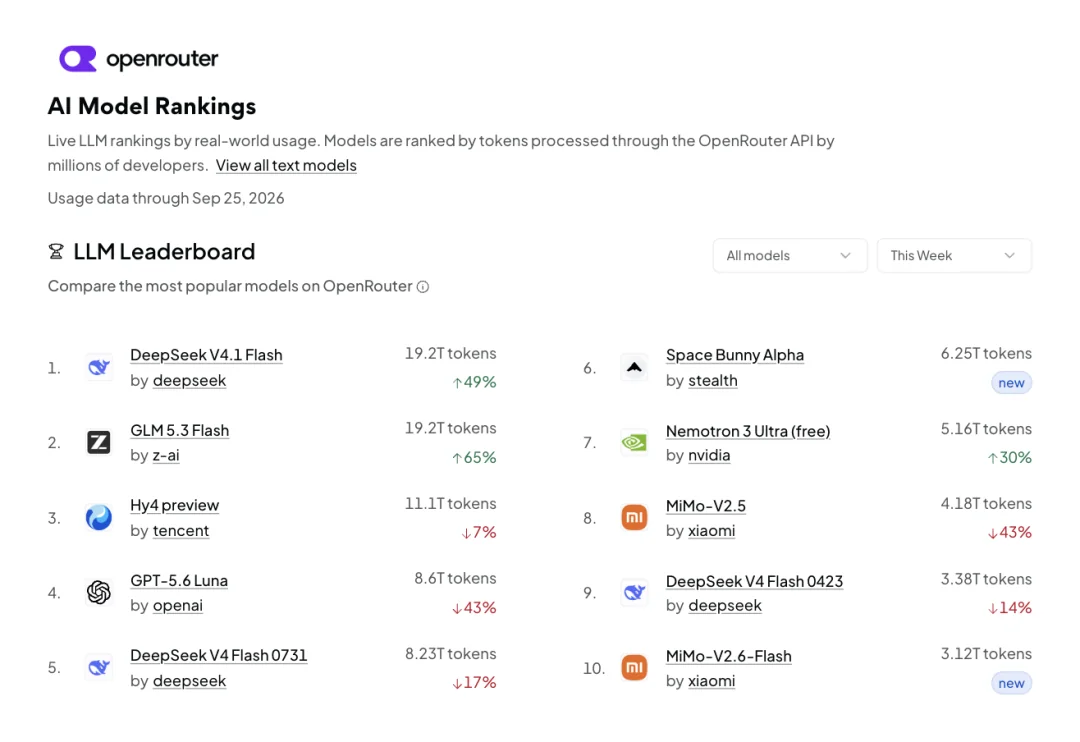
However, there is one thing you must pay special attention to when reading OpenRouter data: whether the model was free at release. In my view, this is often the core factor determining usage. Many models offer a free version on OpenRouter early on; the seventh model on the weekly ranking above is a free model with “free” right in its name. Free models can easily drive up usage in a short time: developers use them for all kinds of tests and batch jobs, or simply start using them because they cost nothing. But a model whose usage rises quickly is not necessarily a good model; it may simply be free. So when reading OpenRouter rankings, first check whether the model had a free version during the period measured, and only then compare its usage with paid models.
The more convincing signal is whether developers are still willing to pay to keep using it after the free period ends.
Beyond that, price, speed, and access channels also affect usage; cheap models naturally get called more often. So this kind of data can only be one reference among others and cannot replace specific feedback from use.
Conclusion
Back to the question at the beginning: who actually decides which large model ranks first?
The answer is a chain of choices. Vendors choose which tests, which versions, and which frameworks to publish; Artificial Analysis chooses which ten evaluations to include, how to weight them, and which questions to keep secret; Arena’s ranking depends on who is voting and what they asked; Terminal-Bench’s maintainers decide which questions to remove, which to modify, and how much time to allow.
Every first place is the combined result of these choices. Each of these choices has a reasonable justification; the problem is that when the results are spread, they are usually all left out.
So my conclusion is: benchmarks are worth consulting, but not worth worshipping. They can help you quickly narrow your candidates and understand roughly what a model is good at; but the final judgment is best based on real feedback from the community and your own hands-on experience.
Also remember that models have different directions of development to begin with, and everyone’s work is different. Some models are good at writing code and operating terminals, some at search and tool calling, some at long-document analysis, and some win on being cheap and fast. There is no single model that is best for everyone. Rather than worrying about who is first, find the one that best fits your own work, and be willing to spend a week seriously trying each new version when it comes out.
Sources
Artificial Analysis
- Intelligence Index methodology (v4.3.2)
- v4.3 announcement
- Terminal-Bench 4.0 evaluation page
- Evaluation of Kimi K3 at release
- Kimi K3 model page
- GLM-5.3-Flash model page
- DeepSeek V4 Flash 0731 evaluation
- Grok 4.6 evaluation
- Model comparison · Kimi K3 vs GPT-5.6 Sol
- Model comparison · GLM-5.3 vs Claude Opus 5
- Model comparison · Qwen3.8 Max vs Claude Fable 5
- Model comparison · DeepSeek V4 Pro vs MiniMax-M3
- Model comparison · MiMo-V2.6-Pro vs GLM-5.3
- Model comparison · DeepSeek V4 Flash vs GPT-5.6 Luna
- Company history · Latent Space interview
- Company history · AI Wiki entry
- Company history · Artificial Analysis “About” page
- Company history · Consilium speaker profile
- Company history · Andrew Ng’s post
- Company history · Latent Space episode video
Benchmark projects
- Terminal-Bench · News and version timeline
- Terminal-Bench · 2.1
- Terminal-Bench · 3.0
- Terminal-Bench · 4.0
- Terminal-Bench · Leaderboard integrity update
- Terminal-Bench · Snorkel 4.0 leaderboard
- HLE (Wikipedia)
- GDPval (OpenAI)
- SWE-bench · OpenAI stops reporting SWE-bench Verified
- SWE-bench · OpenAI’s review of SWE-bench Pro
- DeepSWE (Datacurve)
- Agents’ Last Exam (Berkeley)
- Arena · Battle Mode guide and interface example
- Arena · Ranking method
- Arena · Style and sentiment control research
- Arena · The Leaderboard Illusion
- Arena · Arena’s response
- Anthropic: Infrastructure noise in terminal agent evaluations
Adoption data
Vendor release materials
- Official page and model card · Kimi K3
- Official page and model card · GLM-5.3
- Official page and model card · DeepSeek V4 Pro 0813
- Official page and model card · MiMo-V2.6-Pro
- Official page and model card · Hy4 preview
- Official page and model card · MiniMax-M3 model card
- Official page and model card · MiniMax M3 release
- Official page and model card · Seed2.1
- Official page and model card · Gemini 3.8 Flash release
- Official page and model card · Google Gemini performance table
- Third-party summary · Claude Opus 5.5
- Third-party summary · GPT-6 Astra
- Third-party summary · Grok 4.7
- Third-party summary · Grok 4.6
- Third-party summary · Qwen3.8 Max
- Third-party summary · Qwen3.8 Max 0902 update
- Third-party summary · GLM-5.3
- Third-party summary · MiMo-V2.6
- Third-party summary · Step 5 Preview
- Third-party summary · Hy4 preview
- Third-party summary · DeepSeek V4 Pro 0813
- Third-party summary · Kimi K3 release coverage
- Third-party summary · Kimi K3 benchmark notes (Emergent)
- Third-party summary · GPT-6 Astra ExploitBench analysis (VulDB)